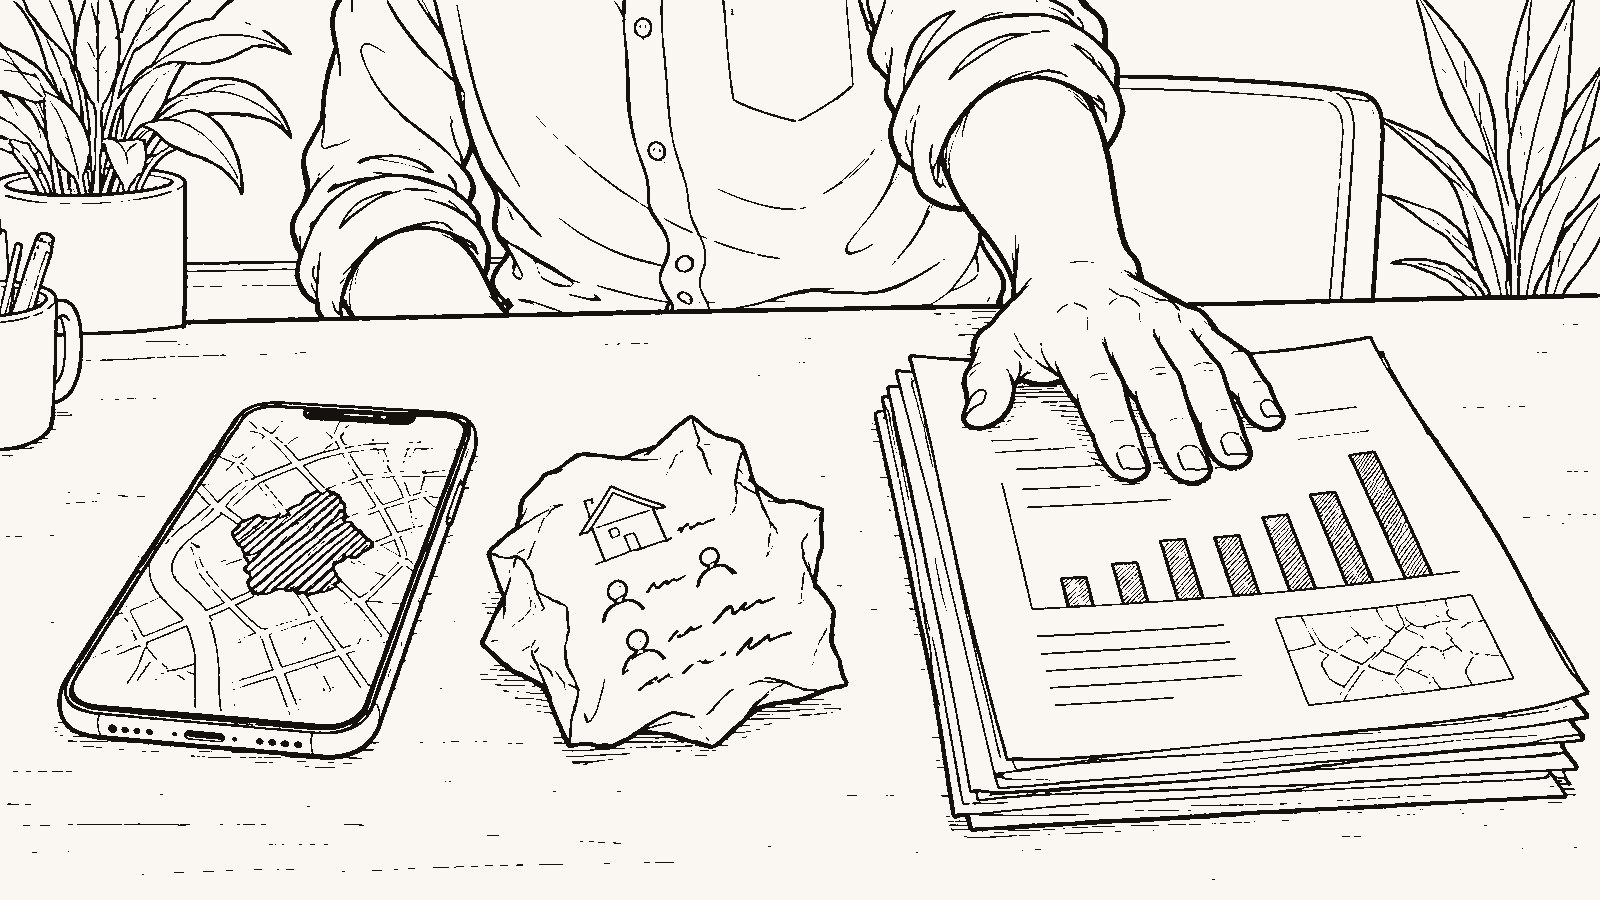
You are not deciding whether an area is safe. You are deciding whether the crime figure in front of you is good enough to act on, or whether it is a score, a rumor, or a raw count that you still have to trace back to the original record before it changes where you buy.
That is a smaller decision than it sounds, and it is the one you can make from a desk. A portal gives you a color and a letter grade, and a forum gives you one person’s worst night. A department’s public data gives you a category, a boundary, a period, and a count. Only the last of those tells you what it measures, and until you know what a number measures, you do not know what it says.
The method below is a set of four questions you ask of every figure, followed by two things you check in person. It ends with you knowing why you believe what you believe about the block you are about to spend years on.
Where did this number come from?
Take any crime figure you have been given and write down the source next to it. This takes longer than reading the figure, and for some figures you will never find the source, which is its own answer. There are four kinds. A portal score or heat map is an estimate: a model built from data the site does not fully disclose, applied to a boundary the site drew. A portal that cites the FBI as its source has still drawn its own boundary and picked its own period, so the citation tells you where the counts came from and nothing about what the score did with them. A news story or a forum post is a local observation at most, and often a single event retold. A department’s own published data, the FBI’s Crime Data Explorer, or a city open-data portal is an official record. Your own visit is personal verification.
The FBI Crime Data Explorer at https://cde.ucr.cjis.gov/ shows reported crime by participating agency and explains which agencies submitted data for which years (official record). Participation is not universal, and an agency that changed reporting systems can show a gap or a jump that is about paperwork rather than crime. Your target city’s police department or the county sheriff usually publishes its own data, sometimes as an incident map and sometimes as nothing more than an annual report or a public records request. Find the department that covers the exact address. An address one street outside a city limit can be a sheriff’s address, and the sheriff’s data lives somewhere else.
The cost of this step is that you will sometimes find nothing usable. Some departments publish annual totals for the whole city and nothing smaller. When that happens, you have learned that the portal score for that neighborhood was built on something coarser than a neighborhood, and you should weigh it that way.
Is it a count or a rate?
A count is a number of incidents. A rate is a count divided by a population over a period. Twelve burglaries in a beat of 900 households and twelve burglaries in a beat of 9,000 households are the same count and different rates. A crime number without a boundary, a period, and a population is a number, and you cannot compare it to anything.
Assume the department gives you counts. To turn a count into a rate you need the population of the same boundary, and that is where the method gets honest. The Census Bureau publishes population by tract, place, and ZIP at https://data.census.gov/ (official record), but a police beat is rarely a census tract. You will usually be dividing a count from one shape by a population from a different shape. Write that mismatch down next to the rate. A rate you built yourself with a known mismatch is more useful than a portal rate whose boundaries you cannot see, and it is still not a clean number.
What boundary and what period?
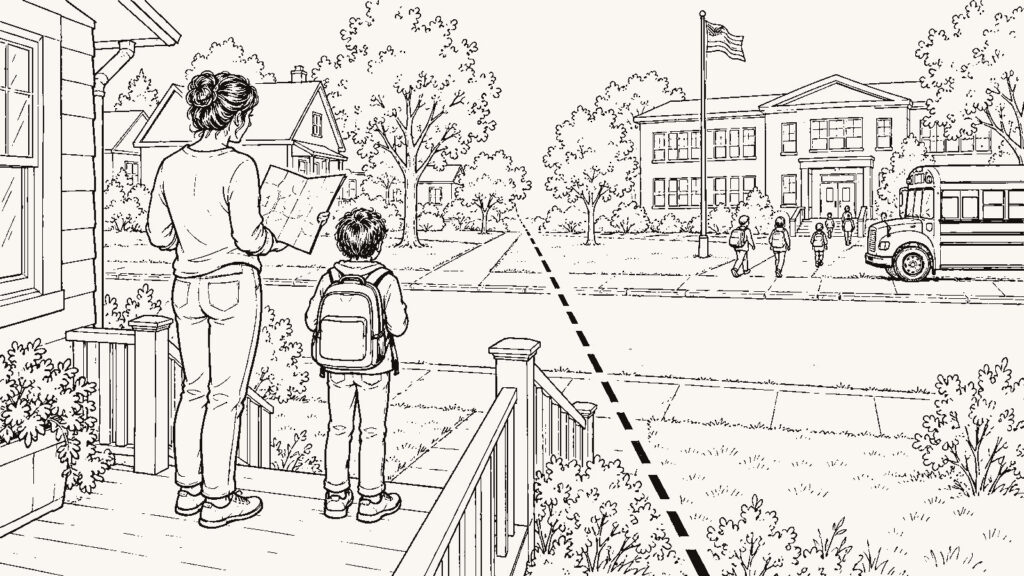
Every figure belongs to a shape and a span of time. The shape might be a police beat, a reporting district, a census tract, a ZIP code, a city limit, or a polygon a portal drew and named after a neighborhood. The span might be a month, a calendar year, or a rolling twelve months. Two figures with different shapes or different spans cannot be compared, even if they share a name.
Find the department’s beat or district map. Many departments publish one on their own site or on a city GIS portal (official record). Put the address on it and note which beat it sits in and where the beat’s edges are. A house one block inside a beat carries that beat’s number even if its daily life faces the beat next door. Then note the period the data covers and whether the department updates monthly, quarterly, or annually. The downside of taking boundaries seriously is that your figure gets less confident. You will end up with a sentence like “this beat recorded these counts over these three years, and the beat runs eight blocks past the streets I care about.” That sentence is less satisfying than a grade, and it is the one you can defend.
Is this one incident or a pattern?
An incident map shows dots. One dot is a fact about one night. It tells you nothing about the next night. A pattern is the same category recurring at the same block across more than one period.
Pull the same category for the same boundary across three or more consecutive periods. Is the count rising, flat, or falling? A single year is a snapshot, and a snapshot taken right after a bad month looks different from one taken right after a quiet one. If the department’s map lets you filter by date and category, look at the block itself: is there one dot in two years, or the same kind of dot every few months? You are looking for repetition, and a headline is one dot with a reporter attached. The cost here is time, and the possibility of reading a pattern into noise. Small boundaries produce small counts, and small counts swing. Three burglaries one year and one the next is not a trend in a beat of 600 homes. Treat a change as real only when it holds across several periods, and say so in your notes.
Calls, offenses, and what the record does not measure
Department data comes in more than one kind. Calls for service are records of someone phoning the department. Offenses or reported crimes are records of something the department classified as a crime after responding. Cleared cases are the subset that ended in an arrest or other closure. A map of calls will look busier than a map of offenses for the same block, because a call can be a noise complaint, a welfare check, or a false alarm. Know which one you are looking at before you put it next to another figure.
Every one of these is reporting data. It measures what was reported and recorded, not everything that happened. The Bureau of Justice Statistics runs the National Crime Victimization Survey at https://bjs.ojp.gov/programs/ncvs because people never report a large share of crime to police, and the survey counts what the police records miss (official record). A low count can mean few incidents or few reports, and you cannot tell which from a desk.
One more limit: a rate describes a boundary over a period. The record tells you what a beat recorded. It does not tell you what will happen at your house next year, and no source does.
What this method costs you
You will spend two evenings on a department website instead of ten seconds on a score, and you may finish with less certainty than you started with. The department may publish nothing smaller than a citywide total. The beat boundary and the census tract may not line up, so your rate carries an asterisk. And the one incident you find on the block could be the first or the tenth, with nothing on the map to say which.
The score offered a decision. This method offers a description with its gaps labeled. If you want a number to decide for you, this is the wrong article. If you want to know why you believe what you believe about a block, this is the only way we know to get there.
A note on what an agent can say
HUD’s guidance on the Fair Housing Act, at https://www.hud.gov/program_offices/fair_housing_equal_opp/fair_housing_act_overview, allows agents and housing providers to share crime and school information when they share it consistently and without discriminatory intent (official record). The Fair Housing Act still applies. An agent may point you to the department’s data and decline to characterize an area. That is compliance, and it is the answer you want, because an agent’s adjective is not a source and the department’s map is.
We hold ourselves to the same line. We show you how to find the record, and we never tell you which neighborhoods are safe, because that is a ranking dressed as a fact and it would replace your judgment with ours.
What should I ask a local
A person who lives on the block can answer the question the record cannot, as long as you ask for reasoning and not a verdict. Ask which streets he walks after dark and which he does not, and why. Ask whether anything on this block has happened more than once in the past two years, and whether the police reports for this address go to the city or the county. Then ask what one thing about the block the map would not show you. Everything he says is local observation. It is one person’s view from one house, and it is worth more than a score and less than the record.
What should I ask my agent
Ask where the department’s public crime data for this address lives and how to find the beat boundary. Ask whether any seller disclosure or listing note for this property mentions an incident. If the agent points you to the source instead of describing the area, that is the right answer. If the agent describes the area instead of pointing you to the source, you have learned something about the agent and nothing about the block.
What must I verify personally
Before you make an offer on a specific address:
- Identify the department that covers the address. Confirm whether the address is inside the city limit or in unincorporated county, because that changes whose data you pull.
- Find the beat or district that contains the address on the department’s own map. Write down where the boundary runs relative to the streets you would use.
- Pull the same category for that boundary across at least three consecutive periods. Write down whether the figures are calls, offenses, or cleared cases.
- Get the population for the nearest census geography and build a rate. Write the boundary mismatch next to it.
- On the incident map, look at the block itself. Note whether any category repeats across periods.
- Stand at the address at 7:40 on a weekday morning, at 6 on a weeknight, and at 11 on a Friday night. Walk to the nearest corner. Note the lighting, whether people are out and what they are doing, and what you hear. No listing photo was taken at those hours, and no department map records them. You only see the nights you are there, so this adds to the record rather than replacing it.
- Call the department’s non-emergency line and ask what crime data they publish, how small the boundaries go, and how often it updates.
Related: What to Verify Yourself Before You Trust Any Relocation Guide, The Neighborhood Scouting Trip: What to Check Before You Make an Offer, and How to Research a Neighborhood From Hundreds of Miles Away.